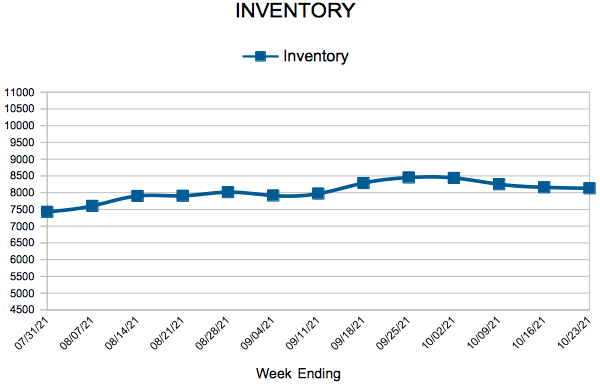
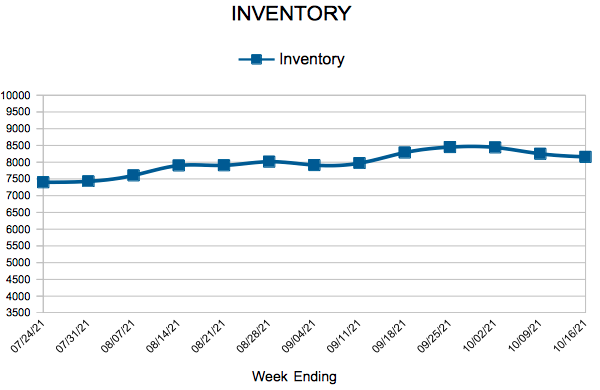
Inventory
612-558-1084

 For Week Ending October 30, 2021
Millennials are leading the housing boom, accounting for 37% of home purchase over the last year, according to Barron’s. Increasing net worth, household formation, low mortgage rates, and a robust economy are a few of the reasons behind the recent growth of homebuyers in this age segment. With Millennials representing 22% of the U.S. population–and with their peak earning years ahead—experts remain optimistic about this generation’s impact on the housing market.
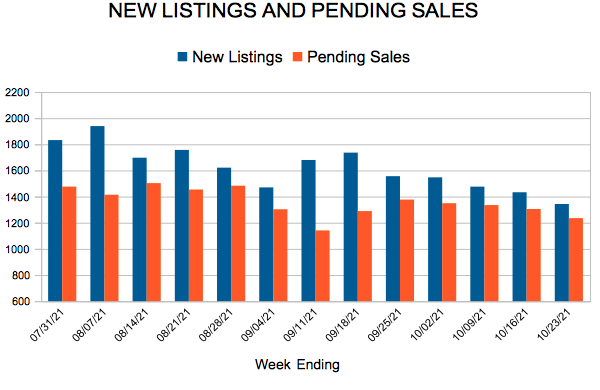
IN THE TWIN CITIES REGION, FOR THE WEEK ENDING OCTOBER 30:
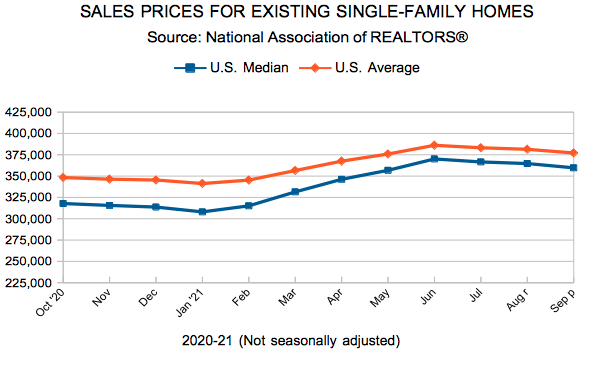
FOR THE MONTH OF SEPTEMBER:
All comparisons are to 2020
Click here for the full Weekly Market Activity Report. From MAAR Market Data News.
 For Week Ending October 23, 2021
Mortgage rates are on the rise, with the 30-year fixed-rate mortgage averaging 3.09% for the week ending October 21, 2021, according to Freddie Mac. Rates have climbed nearly one-third of a percent since early August. Despite increasing rates, which are projected to remain above 3% for the fourth quarter and rise even further next year, economists are expecting the housing market to continue to be active into 2022, thanks in part to strong buyer demand and increases in new listings.
IN THE TWIN CITIES REGION, FOR THE WEEK ENDING OCTOBER 23:
FOR THE MONTH OF SEPTEMBER:
All comparisons are to 2020
Click here for the full Weekly Market Activity Report. From MAAR Market Data News.

 For Week Ending October 16, 2021
The supply of entry-level housing is at its lowest level in nearly five decades, according to Freddie Mac, who reports that entry-level home construction decreased from 418,000 units per year in the 1970s to 65,000 units per year in 2020. The shortage of starter homes has proven challenging to first-time buyers, as many existing entry-level homes are being remodeled or demolished and replaced by much larger homes, while those that remain have become significantly more expensive, with sales prices increasing 64% from 2016, according to realtor.com.
In the Twin Cities region, for the week ending October 16:
For the month of September:
All comparisons are to 2020
Click here for the full Weekly Market Activity Report. From MAAR Market Data News.
There are some signs of a potential market shift, even though both new and active listings are down compared to last year and sales are up compared to 2019.