
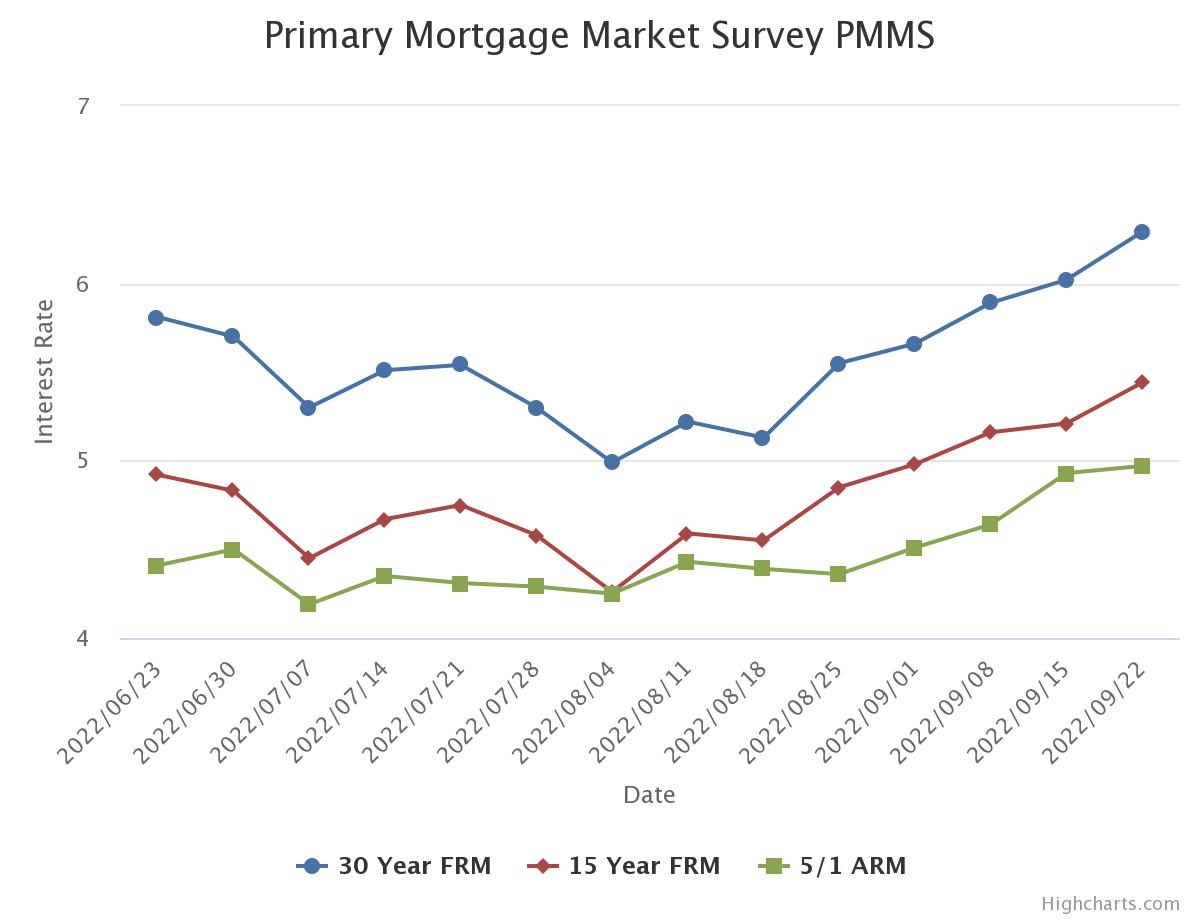
September 22, 2022
The housing market continues to face headwinds as mortgage rates increase again this week, following the 10-year Treasury yield’s jump to its highest level since 2011. Impacted by higher rates, house prices are softening, and home sales have decreased. However, the number of homes for sale remains well below normal levels.Freddie Mac Mortgage Rates
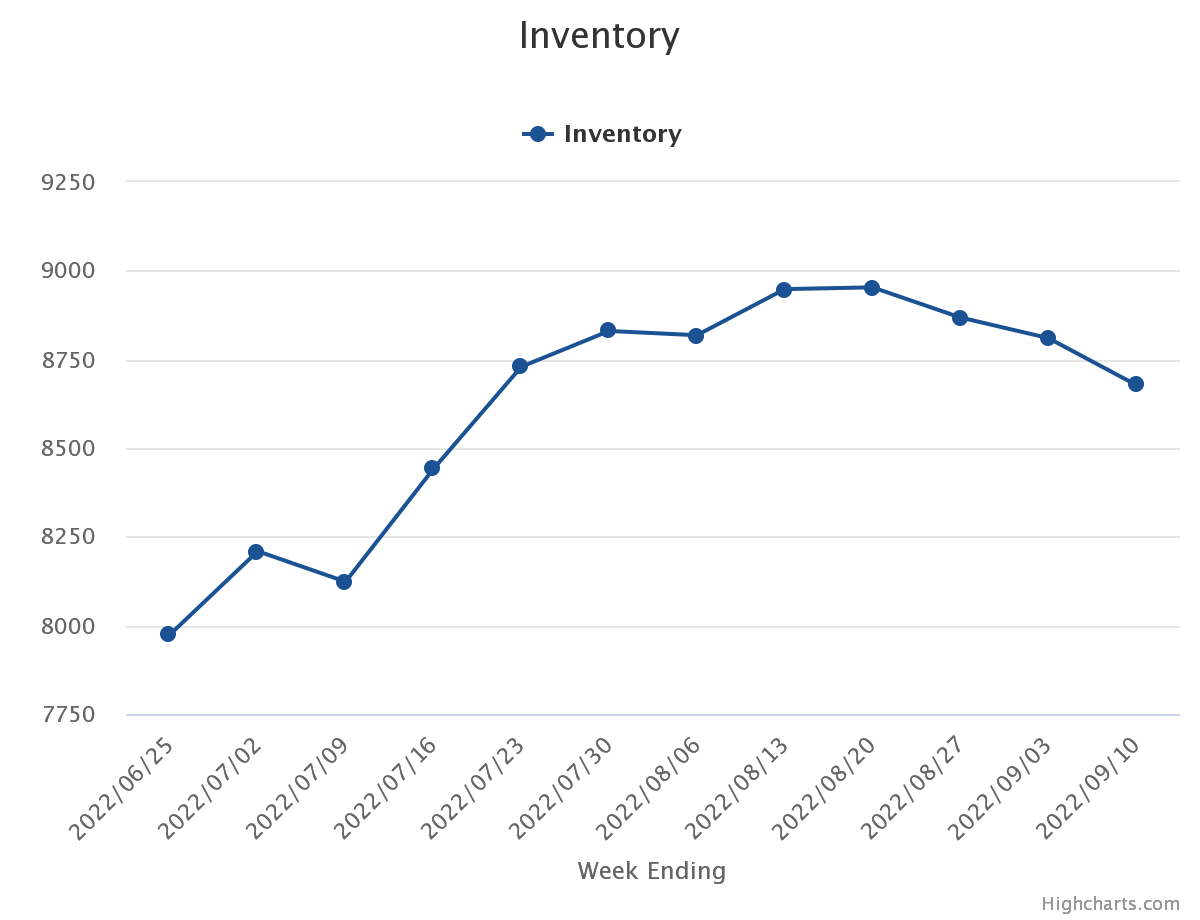
Inventory
Mortgage Rates Continue to Move Up
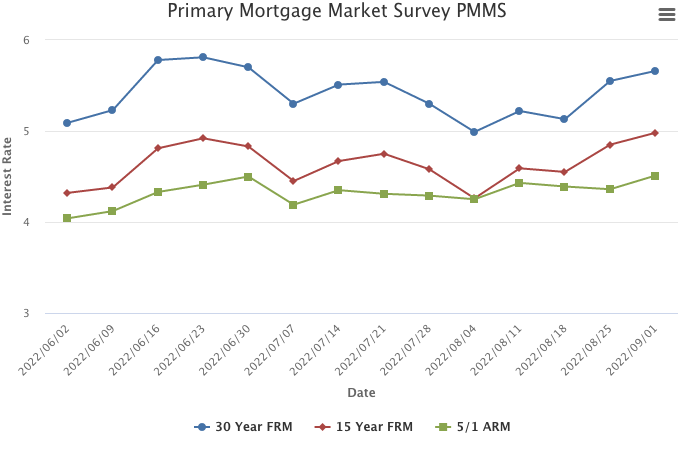
September 1, 2022
The market’s renewed perception of a more aggressive monetary policy stance has driven mortgage rates up to almost double what they were a year ago. The increase in mortgage rates is coming at a particularly vulnerable time for the housing market as sellers are recalibrating their pricing due to lower purchase demand, likely resulting in continued price growth deceleration.
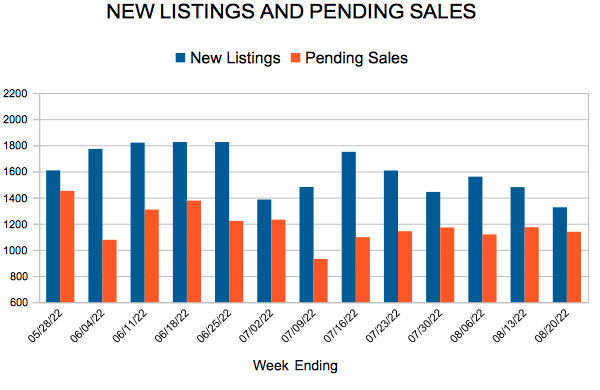
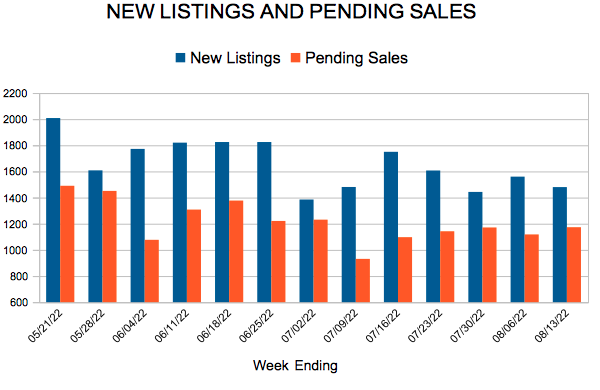
New Listings and Pending Sales
Inventory

Weekly Market Report
 For Week Ending August 20, 2022
Rents continue to soar to new highs amid low vacancy rates, with the median rent hitting $1,879 in the 50 largest U.S. metropolitan areas in July, a 12.3% increase from the same time last year, according to a recent report from Realtor.com. Although rents remain elevated, rent growth appears to be slowing, having increased only $3 from June to July, with tenants in urban areas typically seeing higher rent hikes compared to those in the suburbs.
IN THE TWIN CITIES REGION, FOR THE WEEK ENDING AUGUST 20:
- New Listings decreased 27.3% to 1,326
- Pending Sales decreased 23.5% to 1,138
- Inventory increased 5.1% to 8,953
FOR THE MONTH OF JULY:
- Median Sales Price increased 7.1% to $375,000
- Days on Market increased 15.8% to 22
- Percent of Original List Price Received decreased 2.0% to 101.5%
- Months Supply of Homes For Sale increased 20.0% to 1.8
All comparisons are to 2021
Click here for the full Weekly Market Activity Report. From MAAR Market Data News.
July Monthly Skinny Video
Mortgage Rates Increase
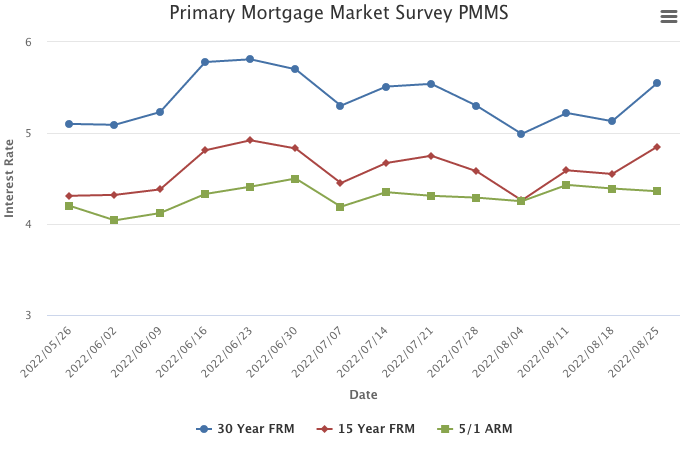
August 25, 2022
The combination of higher mortgage rates and the slowdown in economic growth is weighing on the housing market. Home sales continue to decline, prices are moderating, and consumer confidence is low. But, amid waning demand, there are still potential homebuyers on the sidelines waiting to jump back into the market.
Information provided by Freddie Mac.
New Listings and Pending Sales
Inventory

- « Previous Page
- 1
- …
- 75
- 76
- 77
- 78
- 79
- …
- 135
- Next Page »