July 21, 2022
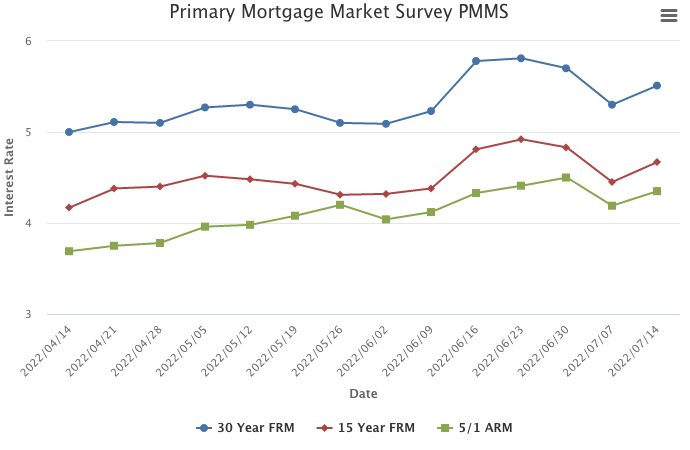
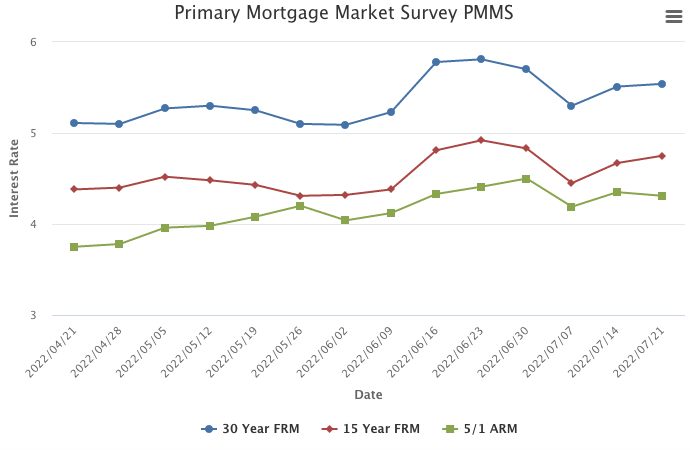
The housing market remains sluggish as mortgage rates inch up for a second consecutive week. Consumer concerns about rising rates, inflation and a potential recession are manifesting in softening demand. As a result of these factors, we expect house price appreciation to moderate noticeably.
Information provided by Freddie Mac.

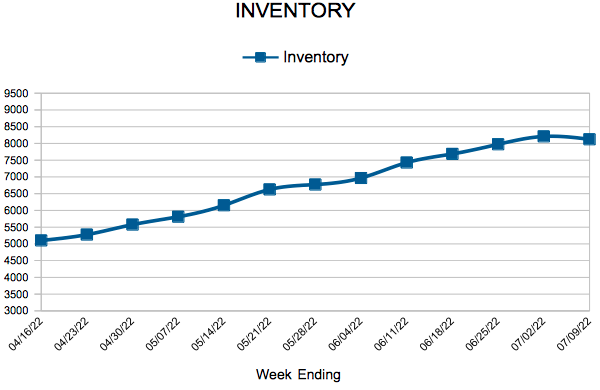
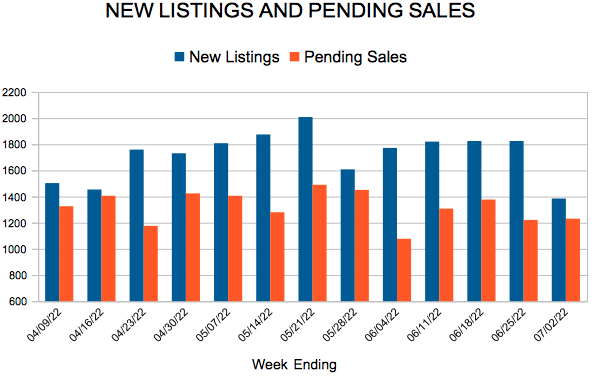
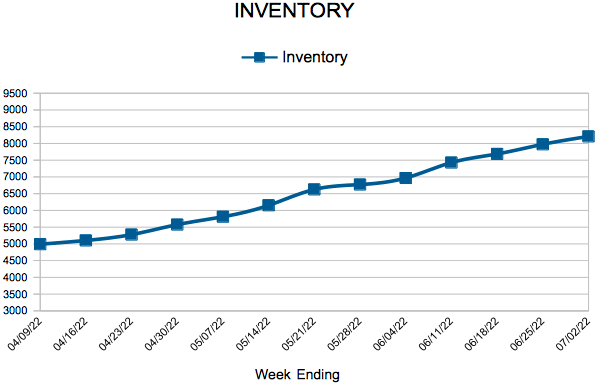
 For Week Ending July 9, 2022