
Weekly Market Report
 For Week Ending December 20, 2025
Nationally, housing inventory improved for the 25th consecutive month, rising 12.6% year-over-year, according to Realtor®.com’s November 2025 Monthly Housing Market Trends Report. However, the pace of active listings has eased each of the last six months, retreating from a peak of roughly 30% year-over-year growth in May and June. Inventory advanced in all four regions in November, led by the West at 14.3%.
IN THE TWIN CITIES REGION, FOR THE WEEK ENDING DECEMBER 20:
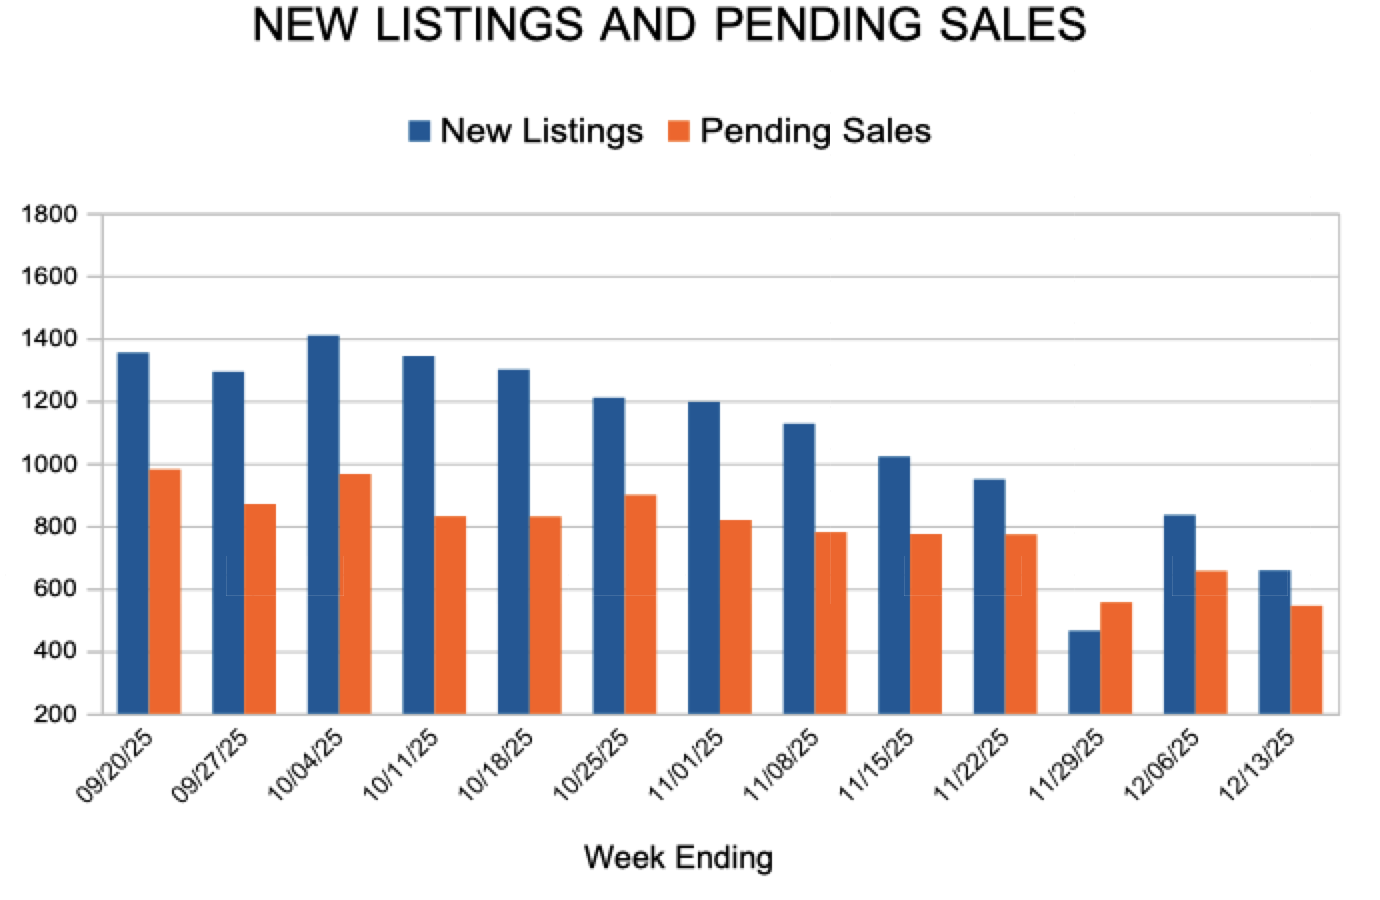
- New Listings decreased 6.3% to 477
- Pending Sales decreased 18.9% to 501
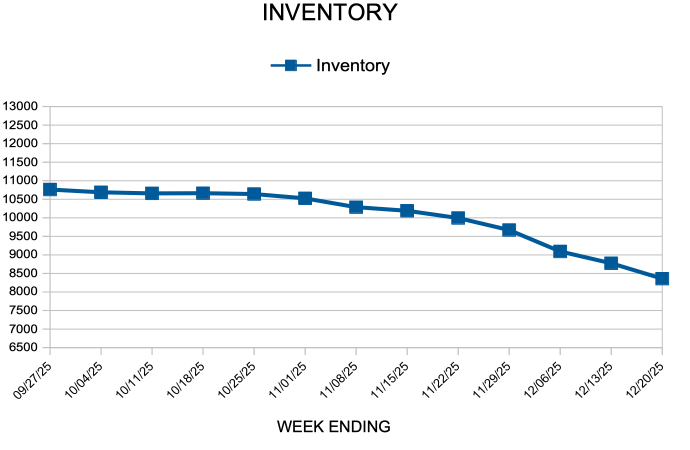
- Inventory decreased 2.9% to 8,359
FOR THE MONTH OF NOVEMBER:
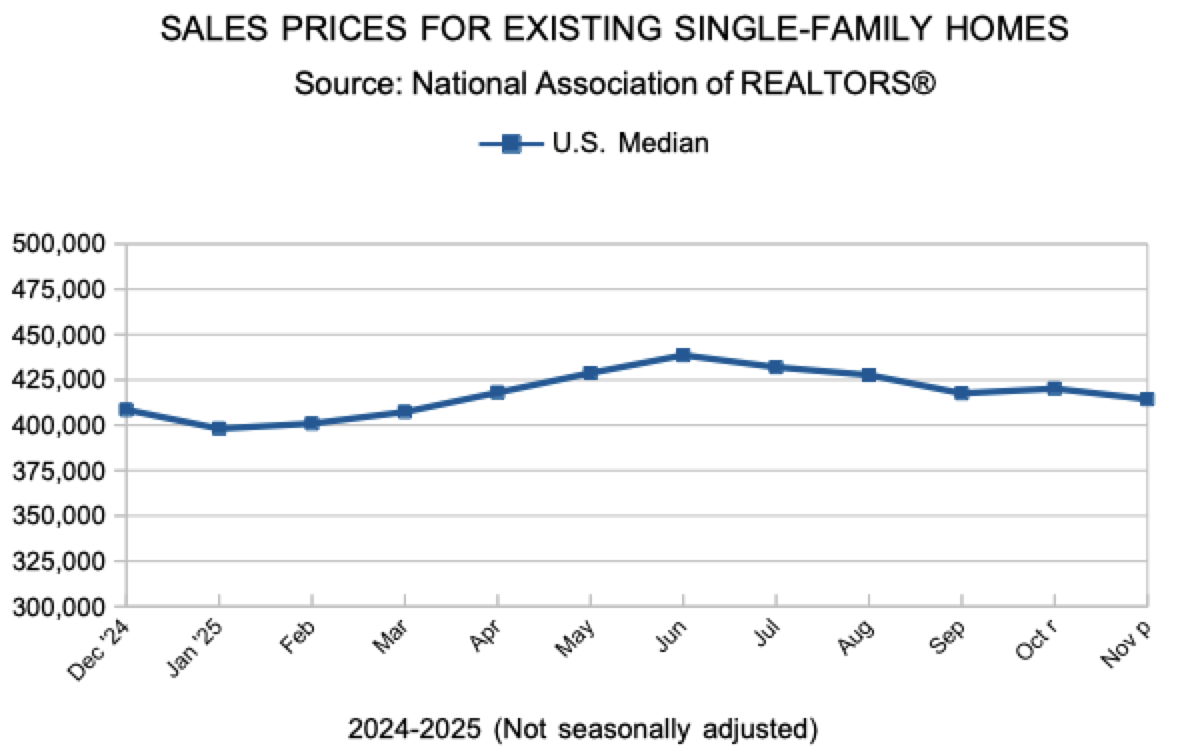
- Median Sales Price increased 2.9% to $387,000
- Days on Market remained flat at 50
- Percent of Original List Price Received decreased 0.2% to 97.4%
- Months Supply of Homes For Sale decreased 4.0% to 2.4
All comparisons are to 2024
Click here for the full Weekly Market Activity Report. From MAAR Market Data News.
Heading into the Christmas Holiday, Rates Dip Lower
December 24, 2025
The average 30-year fixed-rate mortgage decreased further this week. Declining rates offer a timely and welcome gift for aspiring homebuyers.
- The 30-year fixed-rate mortgage averaged 6.18% as of December 24, 2025, down from last week when it averaged 6.21%. A year ago at this time, the 30-year FRM averaged 6.85%.
- The 15-year fixed-rate mortgage averaged 5.50%, up from last week when it averaged 5.47%. A year ago at this time, the 15-year FRM averaged 6.00%.
Information provided by Freddie Mac.
Existing Home Sales
New Listings and Pending Sales
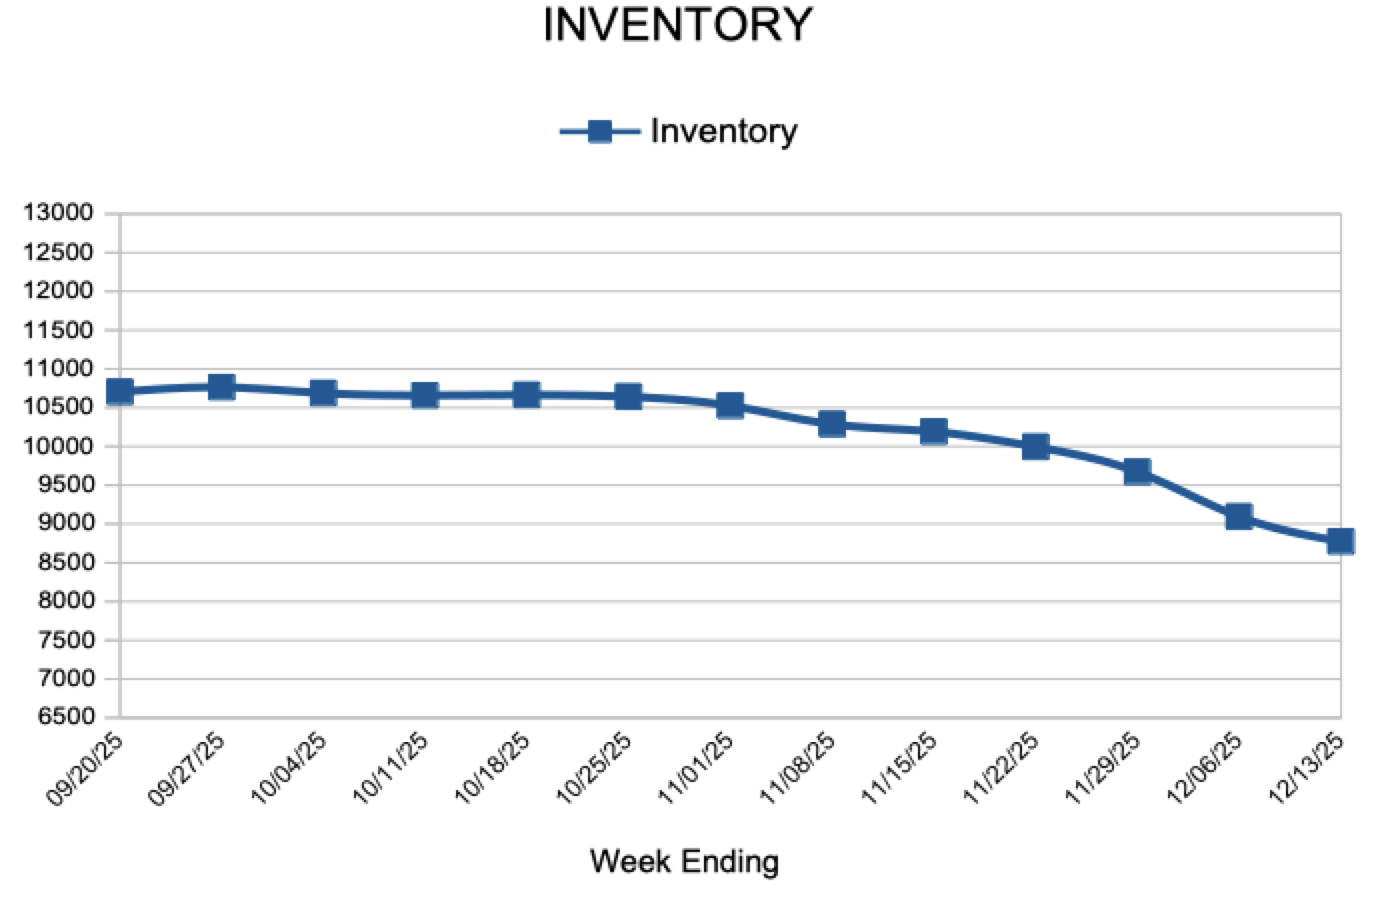
Inventory
Weekly Market Report
For Week Ending December 13, 2025
The share of first-time homebuyers fell to a record low of 21% in 2025, while the median age of first-time buyers climbed to an all-time high of 40, according to the National Association of Realtors®’ 2025 Profile of Home Buyers and Sellers. Among first-time buyers, the leading sources of down payments were personal savings (59%), financial assets such as 401(k) accounts or stocks (26%), and gifts or loans from family and friends (22%).
IN THE TWIN CITIES REGION, FOR THE WEEK ENDING DECEMBER 13:
- New Listings decreased 11.6% to 658
- Pending Sales decreased 17.9% to 545
- Inventory decreased 2.0% to 8,775
FOR THE MONTH OF NOVEMBER:
- Median Sales Price increased 2.8% to $386,647
- Days on Market remained flat at 50
- Percent of Original List Price Received decreased 0.2% to 97.4%
- Months Supply of Homes For Sale decreased 4.0% to 2.4
All comparisons are to 2024
Click here for the full Weekly Market Activity Report. From MAAR Market Data News.
November Monthly Skinny Video
Mortgage Rates Drop Slightly
December 18, 2025
The average 30-year fixed-rate mortgage has remained within a narrow 10-basis point range over the last two months. With rates down half a percent over last year, purchase applications are 10% above the same time one year ago.
- The 30-year fixed-rate mortgage averaged 6.21% as of December 18, 2025, down slightly from last week when it averaged 6.22%. A year ago at this time, the 30-year FRM averaged 6.72%.
- The 15-year fixed-rate mortgage averaged 5.47%, down from last week when it averaged 5.54%. A year ago at this time, the 15-year FRM averaged 5.92%.
Information provided by Freddie Mac.
New Listings and Pending Sales

- « Previous Page
- 1
- …
- 3
- 4
- 5
- 6
- 7
- …
- 139
- Next Page »