

For Week Ending January 11, 2020
Freddie Mac reported that the average 30-year fixed-rate mortgage dropped to 3.64% this week, the lowest level in three months and down from 4.45% one year ago. Additionally, conforming and FHA loan limits have increased for 2020. Increased loan limits coupled with low rates, will give more buyers the ability to purchase a wider range of properties. These changes, along with the continued strong labor market, is likely to spur buyer demand even in the face of a constrained supply of homes for sale throughout much of the country.
In the Twin Cities region, for the week ending January 11:
- New Listings decreased 4.9% to 998
- Pending Sales decreased 12.2% to 592
- Inventory decreased 15.2% to 7,624
For the month of December:
- Median Sales Price increased 8.0% to $278,600
- Days on Market decreased 1.8% to 56
- Percent of Original List Price Received increased 0.4% to 97.2%
- Months Supply of Homes For Sale decreased 21.1% to 1.5
All comparisons are to 2019
Click here for the full Weekly Market Activity Report. From MAAR Market Data News.
Weekly Market Report
For Week Ending January 4, 2020
With the start of the New Year, the real estate market turns more active across mostof the country. Sellers connect with agents, resulting in a pop of new listings, followed by renewed interest by buyers, which leads to an increase in pending sales. This pattern is seen every year and 2020 should be no different. We’re starting off the year with continued low interest rates, low unemployment, and rising rents nationally. This sets us up for a strong start to 2020 and plenty of optimism for the coming spring market.
In the Twin Cities region, for the week ending January 4:
- New Listings decreased 17.9% to 683
- Pending Sales decreased 7.0% to 546
- Inventory decreased 12.8% to 8,064
For the month of November:
- Median Sales Price increased 5.6% to $279,900
- Days on Market decreased 1.9% to 51
- Percent of Original List Price Received increased 0.2% to 97.5%
- Months Supply of Homes For Sale decreased 4.5% to 2.1
All comparisons are to 2019
Click here for the full Weekly Market Activity Report. From MAAR Market Data News.
Weekly Market Report
For Week Ending December 28, 2019
Data from the Census Bureau’s Survey of Construction (SOC) and the National Association of Home Builders shows that 62.5 percent of all new construction homes started in 2018 were built as part of a community or homeowner’s association, up from 47.6% in 2009. These associations are typically created when the developments are built to maintain common areas of the developments and to enforce private deed restrictions, which often detail requirements for the exterior appearance and upkeep of properties.
In the Twin Cities region, for the week ending December 28:
- New Listings decreased 15.6% to 259
- Pending Sales decreased 3.7% to 495
- Inventory decreased 14.0% to 8,354
For the month of November:
- Median Sales Price increased 5.6% to $279,900
- Days on Market decreased 1.9% to 51
- Percent of Original List Price Received increased 0.2% to 97.5%
- Months Supply of Homes For Sale decreased 4.5% to 2.1
All comparisons are to 2018
Click here for the full Weekly Market Activity Report. From MAAR Market Data News.
Weekly Market Report
For Week Ending December 21, 2019
As we close out the last weeks of the year, both buyers and sellers turn their focus from the transacting of homes to preparations for celebrating the holidays with their family and friends. Renewed interest by both buyers and sellers will come in the New Year and with it, the expectations for a strong housing market in 2020.
In the Twin Cities region, for the week ending December 21:
- New Listings increased 6.1% to 524
- Pending Sales decreased 1.3% to 706
- Inventory decreased 13.1% to 8,805
For the month of November:
- Median Sales Price increased 5.6% to $279,900
- Days on Market decreased 1.9% to 51
- Percent of Original List Price Received increased 0.2% to 97.5%
- Months Supply of Homes For Sale decreased 9.1% to 2.0
All comparisons are to 2018
Click here for the full Weekly Market Activity Report. From MAAR Market Data News.
November Monthly Skinny Video
Prices increased in year-over-year comparisons, and this will likely remain the case for the rest of the year.
Weekly Market Report
For Week Ending December 14, 2019
This week the Federal Reserve, in its final meeting of the year, voted to leave its key benchmark rate unchanged, which was widely expected. The Fed also suggested that rate changes are unlikely in the coming months. While the rate decisions by the Federal Reserve do not directly affect mortgage rates, Federal Reserve policy does affect the economic markets overall. While mortgage rates have trended up slightly in recent weeks, they remain nearly one percent lower than a year ago. Fed Chair Jerome Powell was upbeat on the economy going forward: “with a strong household sector and supportive monetary and financial conditions, we expect moderate growth to continue.”
In the Twin Cities region, for the week ending December 14:
- New Listings decreased 4.1% to 696
- Pending Sales decreased 0.5% to 744
- Inventory decreased 10.0% to 9,399
For the month of November:
- Median Sales Price increased 5.6% to $279,900
- Days on Market decreased 1.9% to 51
- Percent of Original List Price Received increased 0.2% to 97.5%
- Months Supply of Homes For Sale decreased 9.1% to 2.0
All comparisons are to 2018
Click here for the full Weekly Market Activity Report. From MAAR Market Data News.
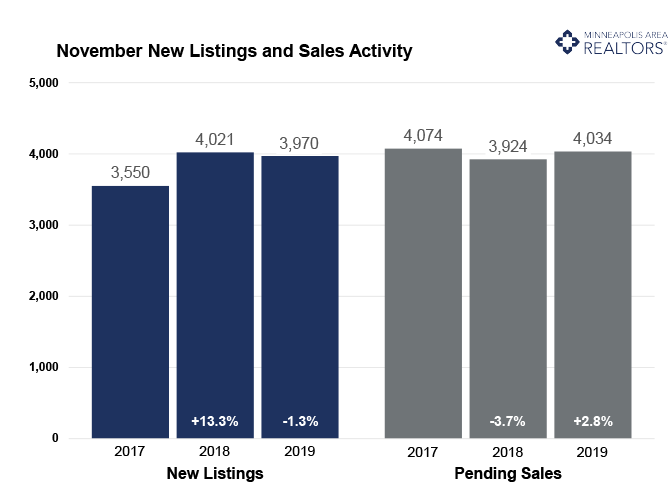
November a mixed bag; new listings up, sales down
December 18, 2019
The Twin Cities real estate market showed a mostly positive but slightly mixed bag of results for November. New listings were up 0.1 percent year-to-date but down slightly in November. Helping to offset that decline was a 25.0 percent gain in newly built homes from last November. That’s because a builder doesn’t have to buy a home after selling one. Despite a sellers’ market and depending on price point, sellers still face the challenge of securing the next property while listing their current home.
Closed sales were also down slightly in November, but year-to-date closings are almost even with 2018. Sales have risen for the previous four consecutive months. Additionally, pending sales—a signed contract indicating a forthcoming closing—have now risen for five consecutive months, including November. This points to solid demand heading into the new year. Despite tight inventory, surprisingly low borrowing rates are helping to support this demand.
The number of homes for sale declined overall, but most price ranges have shown some growth this year. Over the last 12 months, housing inventory levels have increased for homes priced between $200K-$300K, $300K-$500K and over $500K but fell for homes under $200K. That first-time buyer segment still hasn’t seen supply growth.
The median home price in the Twin Cities has risen for 93 months or nearly 8 years, reaching new record highs every year since 2016. This isn’t the case for every market segment or area. The supply-demand imbalance pushes prices higher along with a changing mix of homes selling. There’s been growth in luxury activity and in square footage.
Market times remain brisk and near record lows, but there were a few monthly increases in 2019. Homes priced under $250K sold in a median of 25 days, while that figure was 91 days for homes over $1M.
November 2019 by the Numbers (compared to a year ago)
• Sellers listed 3,970 properties on the market, a 1.3 percent decrease from last November
• Buyers closed on 4,672 homes, a 0.8 percent decrease
• Inventory levels decreased 9.2 percent from last November to 10,011 units
• Months Supply of Inventory was down 9.1 percent to 2.0 months
• The Median Sales Price rose 5.6 percent to $279,900
• Cumulative Days on Market declined 1.9 percent to 51 days, on average (median of 29)
• Changes in Sales activity varied by market segment
o Single family sales rose 2.1 percent; condo sales decreased 10.7 percent; townhome sales fell 4.9 percent
o Traditional sales increased 0.7 percent; foreclosure sales dropped 34.7 percent; short sales were flat
o Previously owned sales were flat; new construction sales climbed 5.3 percent
Quotables
“We’re on solid footing heading into year-end,” said Todd Urbanski, President of Minneapolis Area REALTORS®. “More inventory would be nice, but rates are fantastic, the economy is still growing and consumers are confident.”
“National news headlines have little to do with our local market,” said Linda Rogers, President-Elect of Minneapolis Area REALTORS®. “Our state and local economies are hardy and diversified, good news for home buyers.”
From The Skinny Blog.
Weekly Market Report
For Week Ending December 7, 2019
Both conforming Conventional loan and FHA loan limits are increasing starting January 1, 2020 in an effort to trend higher with increasing home prices. These new higher limits will expand the pool of buyers able to take advantage of the most common financing options for primary residences. Additionally, the VA has announced that due to the Blue Water Navy Veterans Act of 2019, VA loans will no longer have fixed limits starting January 1, 2020, which should raise the number of active duty military and veterans that can take advantage of this great program. Of course in all cases, the borrower must still qualify for the loan amounts they are seeking, regardless of the caps.
In the Twin Cities region, for the week ending December 7:
- New Listings increased 9.6% to 867
- Pending Sales increased 19.2% to 905
- Inventory decreased 8.8% to 9,822
For the month of November:
- Median Sales Price increased 5.6% to $279,900
- Days on Market decreased 1.9% to 51
- Percent of Original List Price Received increased 0.2% to 97.5%
- Months Supply of Homes For Sale decreased 9.1% to 2.0
All comparisons are to 2018
Click here for the full Weekly Market Activity Report. From MAAR Market Data News.
Weekly Market Report
For Week Ending November 30, 2019
Americans across the country sat down to Thanksgiving with friends and family this week. Real estate activity took a backseat to the preparation of meals and the hosting of guests, where securing second helpings were more important than securing second homes. As we enter the final weeks of 2019, there is strength and optimism in the housing market, but at a pace that is muted due to the holiday season. The relatively low levels of inventory coupled with continued strong buyer activity are the common refrains across much of the country.
In the Twin Cities region, for the week ending November 30:
- New Listings decreased 43.6% to 501
- Pending Sales decreased 26.3% to 702
- Inventory decreased 6.6% to 10,461
For the month of October:
- Median Sales Price increased 5.7% to $280,000
- Days on Market decreased 4.2% to 46
- Percent of Original List Price Received increased 0.2% to 98.1%
- Months Supply of Homes For Sale decreased 4.0% to 2.4
All comparisons are to 2018
Click here for the full Weekly Market Activity Report. From MAAR Market Data News.
Weekly Market Report
For Week Ending November 23, 2019
Residential new construction activity continues to rise nationally. The U.S. Commerce Department reports that new housing permits rose 5% in October to a new 12-year high of 1.46 million units. Lawrence Yun, the National Association of REALTORS® chief economist, called the latest figures “tremendously good news for the housing sector.” With builder sentiment and buyer activity remaining strong, it is widely expected that new construction will continue to remain brisk in the coming months.
In the Twin Cities region, for the week ending November 23:
- New Listings increased 74.1% to 928
- Pending Sales increased 39.8% to 966
- Inventory decreased 6.6% to 10,724
For the month of October:
- Median Sales Price increased 5.7% to $280,000
- Days on Market decreased 4.2% to 46
- Percent of Original List Price Received increased 0.1% to 98.1%
- Months Supply of Homes For Sale decreased 4.0% to 2.4
All comparisons are to 2018
Click here for the full Weekly Market Activity Report. From MAAR Market Data News.
- « Previous Page
- 1
- …
- 129
- 130
- 131
- 132
- 133
- …
- 135
- Next Page »