Weekly Market Report
 For Week Ending April 17, 2021
A new analysis by housing giant Freddie Mac suggests that the U.S. housing market needs 3.8 million more single-family homes nationwide to meet demand. Sam Khater, Freddie Mac’s chief economist, noted “we should have almost four million more housing units if we had kept up with demand the last few years.” While new construction activity has increased in recent years, it has never fully recovered to its previous peak more than fifteen years ago.
In the Twin Cities region, for the week ending April 17:
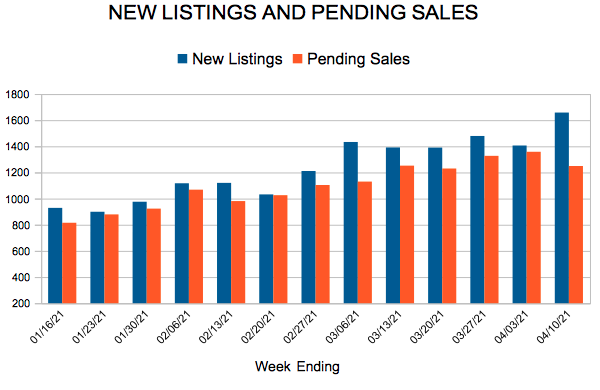
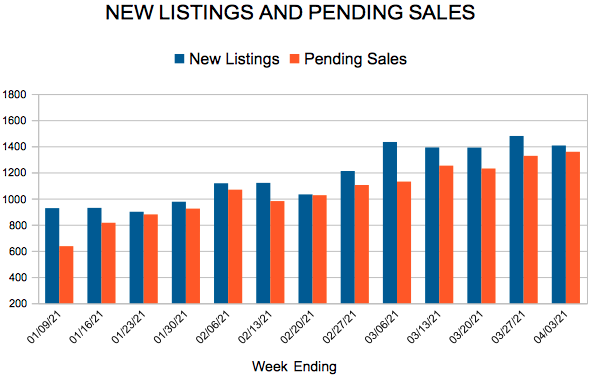
- New Listings increased 19.0% to 1,582
- Pending Sales increased 45.3% to 1,481
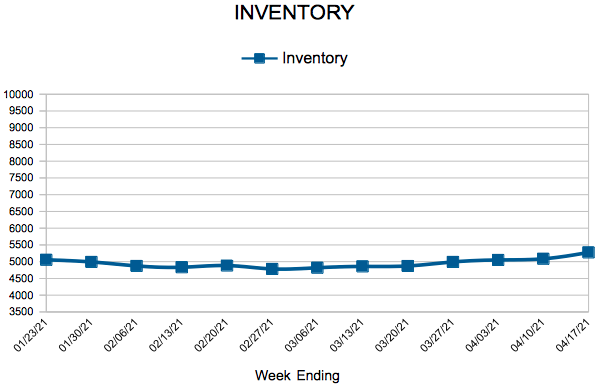
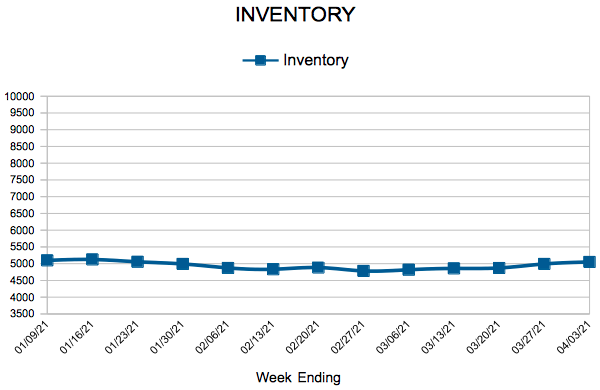
- Inventory decreased 47.6% to 5,276
For the month of March:
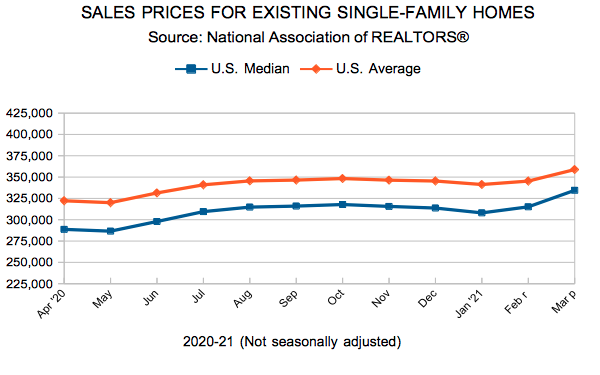
- Median Sales Price increased 10.4% to $328,000
- Days on Market decreased 36.1% to 39
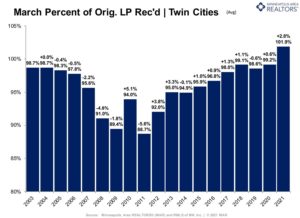
- Percent of Original List Price Received increased 2.7% to 101.9%
- Months Supply of Homes For Sale decreased 55.0% to 0.9
All comparisons are to 2020
Click here for the full Weekly Market Activity Report. From MAAR Market Data News.
Existing Home Sales
March Monthly Skinny Video
New Listings and Pending Sales
Inventory
Weekly Market Report
 For Week Ending April 10, 2021
Home prices are not the only rising cost for prospective homebuyers. ATTOM Data Solutions’ latest property tax analysis of nearly 87 million single-family homes in the U.S. found the average property tax bill rose 4.4 percent from 2019 to 2020, to an average of $3,719 for a single-family home. Nationwide, the average effective tax rate was 1.1% of the property’s value in 2020, down slightly from 1.14% in 2019.
In the Twin Cities region, for the week ending April 10:
- New Listings increased 27.1% to 1,658
- Pending Sales increased 20.8% to 1,249
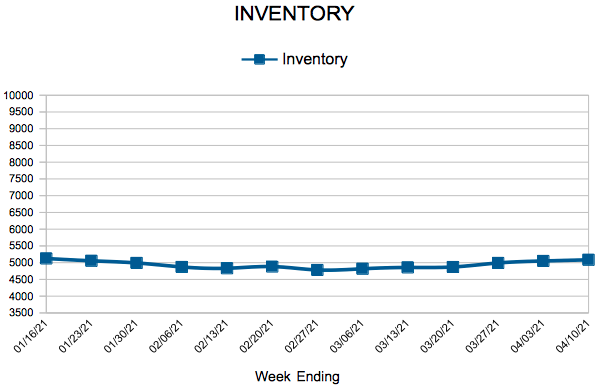
- Inventory decreased 49.3% to 5,086
For the month of March:
- Median Sales Price increased 10.4% to $328,000
- Days on Market decreased 36.1% to 39
- Percent of Original List Price Received increased 2.7% to 101.9%
- Months Supply of Homes For Sale decreased 52.6% to 0.9
All comparisons are to 2020
Click here for the full Weekly Market Activity Report. From MAAR Market Data News.
Tight market pushes home prices to new record high in Twin Cities
Inventory hits an 18-year low with buyers competing for fewer listings
(April 16, 2021) – According to new data from the Minneapolis Area REALTORS® and the Saint Paul Area Association of REALTORS®, the median price of a home in the 16-county Twin Cities metro increased 10.3 percent from last March to a record high of $327,500. Prices were driven in part by a lack of supply.
The number of homes for sale at the end of March was half of what was available a year ago. That marks an 18-year low and amounts to 0.9 months of supply. A balanced market typically has 4-6 months of supply. Market times shrank 37.7 percent to 38 days and multiple offers remain commonplace.
“Demand is still growing faster than supply,” according to Tracy Baglio, President of the Saint Paul Area Association of REALTORS®. “With less than one month of supply, buyers must be patient and understand they may lose out on a few bids before an offer is accepted. Be ready to act fast.”
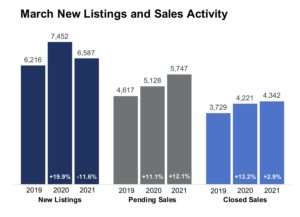
Sellers listed 11.6 percent fewer homes than March 2020, offering little relief to buyers eager for more options. However, sales activity climbed above year-ago levels for the tenth straight month. Buyers continue to be motivated by attractive mortgage rates, a healing labor market and a desire for more space.
“On top of lightning-fast market times, those who choose to sell their home are often rewarded with offers at or above asking price,” said Todd Walker, President of Minneapolis Area REALTORS®. “For buyers, that means writing strong, straightforward offers right away. For sellers, it means their listings will stand out and will likely sell quickly at full price or better.”
Activity varies by area, price point and property type. Sales were up 31.9 percent in Minneapolis and 9.5 percent in St. Paul, suggesting demand remains strong in the core cities. Condos sales rose 31.7 percent, outpacing single-family and townhomes. New construction sales rose 25.5 percent while previously owned homes rose 0.7 percent. Sales of luxury properties ($1M+) have been soaring—up 70.9 percent from last March.
March 2021 by the numbers compared to a year ago
- Sellers listed 6,587 properties on the market, an 11.6 percent decrease from last March
- Buyers signed 5,747 purchase agreements, up 12.1 percent (4,342 closed sales, up 2.9 percent)
- Inventory levels fell 50.7 percent to 4,907 units
- Months Supply of Inventory was down 52.6 percent to 0.9 months (4-6 months is balanced)
- The Median Sales Price rose 10.3 percent to $327,500
- Days on Market decreased 37.7 percent to 38 days, on average (median of 11, down 57.7 percent)
- Changes in Sales activity varied by market segment
- Single family sales were down 1.1 percent; condo sales rose 31.7 percent; townhome sales increased 8.7 percent
- Traditional sales rose 4.5 percent; foreclosure sales were down 42.9 percent; short sales fell 63.2 percent
- Previously owned sales were up 0.7 percent; new construction sales climbed 25.2 percent
New Listings and Pending Sales
Inventory
- « Previous Page
- 1
- …
- 104
- 105
- 106
- 107
- 108
- …
- 135
- Next Page »

